Monitor Your WordPress Site in Real Time
WordPress Capsules expose metrics for Prometheus via built-in exporters running inside the container. The platform scrapes these automatically and makes them available in the Metrics tab of your Capsule's page.
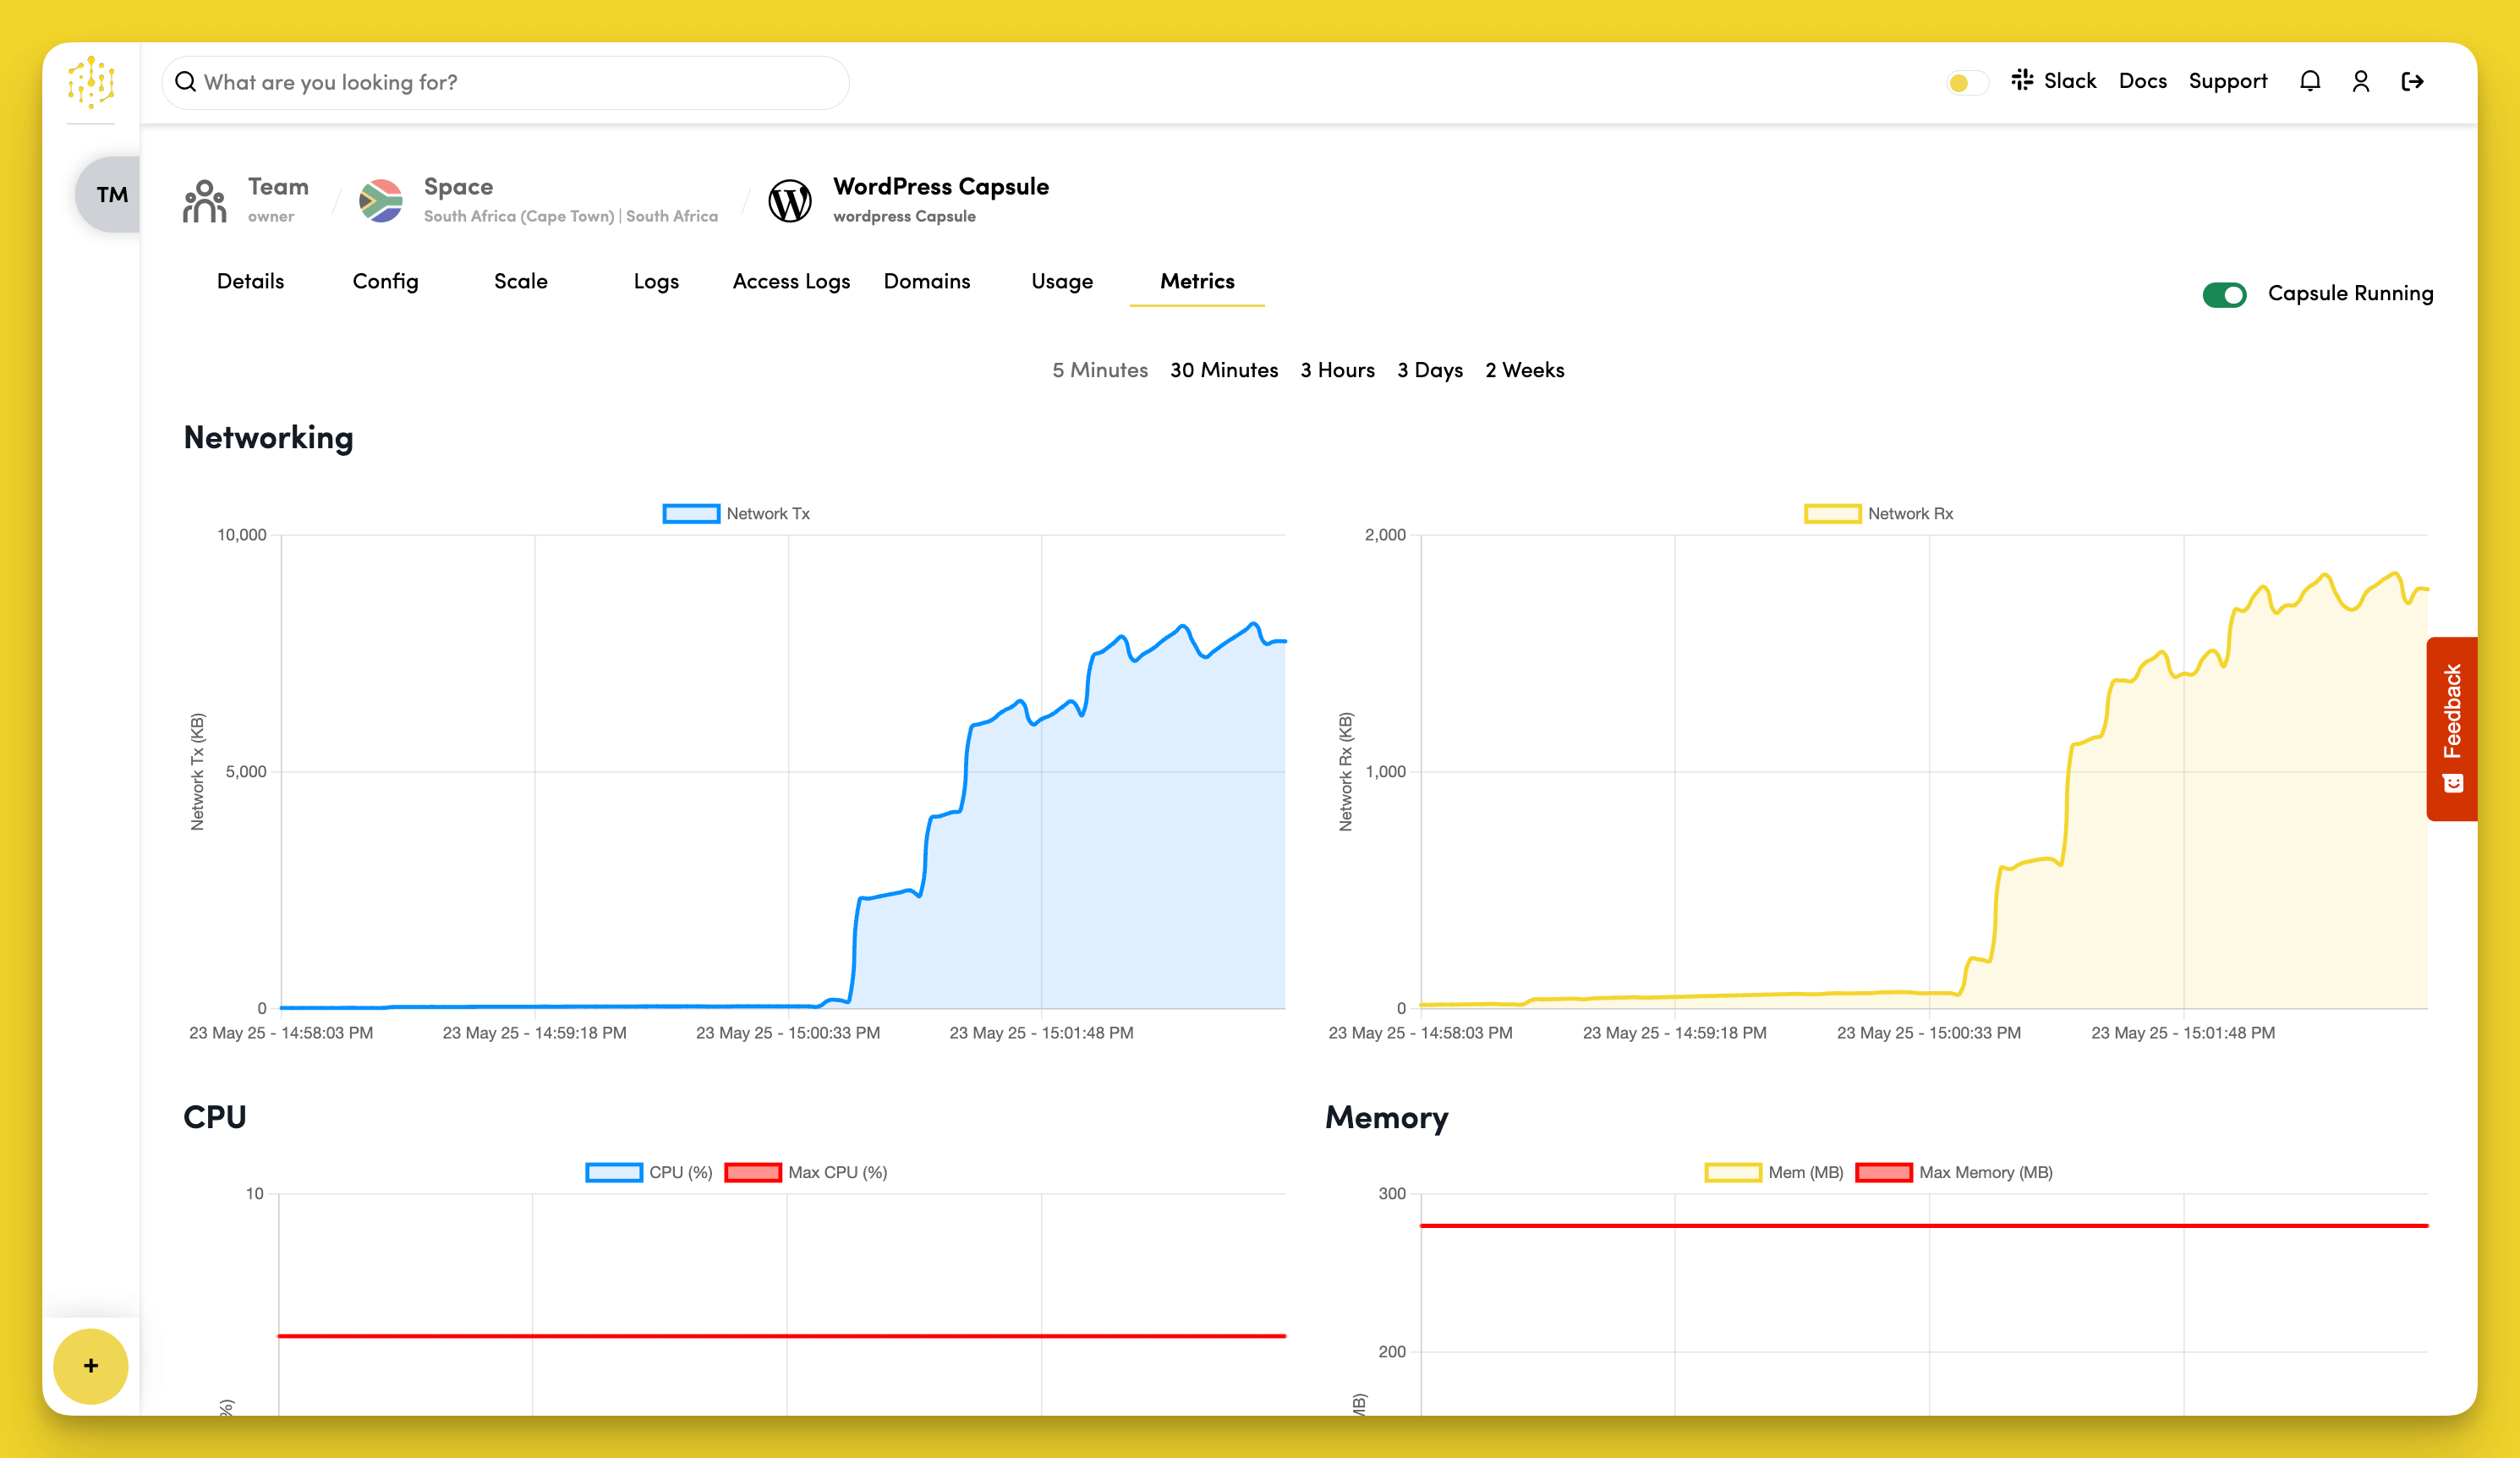
Viewing Metrics
Open the Metrics tab on your Capsule's page to view graphs for CPU, memory, and request throughput. The platform pre-configures dashboards for the WordPress-specific metrics listed above.
For custom Prometheus queries or Grafana dashboards, contact support for access to the platform's Prometheus instance.